

Cohen’s Kappa statistic measure
Cohen’s Kappa Statistic Measure
The Cohen’s Kappa statistic measure was used to find the degree of agreement between two annotators. The Kappa value give a quantitative measure of the agreement in any situation in which or more independent observers evaluating the same thing.
The equation of the Kappa value is $K \equiv \frac{P_o - P_e}{1-Pe} = 1 - \frac{1-P_o}{1-Pe}$, where $P_o$ is the probability of random agreement and $P_e$ is the probability of expected agreement.
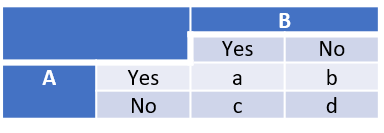
Matrix of two annotators
The matrix above shows the agreement of two persons. The equation of the observed proportionate agreement is $P_o = \frac{(a+d)}{(a+b+c+d)}$.
The equation for the expected probability is $P_e = \frac{(a+b)}{(a+b+c+d)} \times \frac{(a+c)}{(a+b+c+d)} + \frac{(c+d)}{(a+b+c+d)} \times \frac{(b+d)}{(a+b+c+d)}$.
Interpretation of Cohen’s Kappa
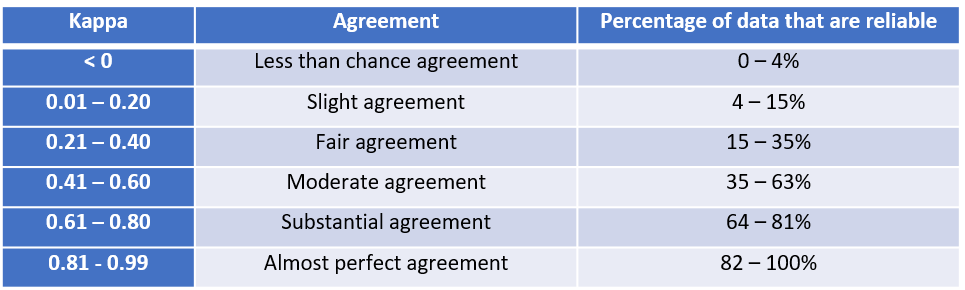
By utilizing the Kappa formula, the kappa value can be interpreted through the interpretation table shown above. In the case of using kappa value as one of metric to evaluate the machine learning models, two annotators can be substituted as true labels and prediction outcome .
Example:
Amazon Mechanical Turk Experiment
Often we need data with labels in order to train models. However, it could be a tough task to gether data with its ground truth, considering the cost of time and money. Amazon Mechanical Turk program provides the solution for researchers to get data labeled in the timeless and cheaper fasions. But, is the tool good enough to be used to label the unlabeled data? Is it better to find the area experts to do the labeling? The experiment is going to find out if AMT is a viable solution for labeling data.
About the Data
Data were sampled from Yelp restaurant reviews. Six restaurant reviews were sampled. There is one one-star review, two two-stars reviews, one four-stars review and two five-stars reviews. The ‘label’ column was created with rules, number of stars below 3 labeled as ‘negative’ and number of stars above 3 labeled as ‘positive’. It is esteemed as the data ground truth. Three restaurant reviews were labeled as ‘n’ and the other three were labeled as ‘p’.
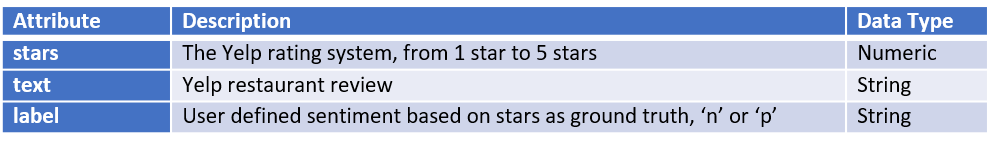
Dataset Dictionary
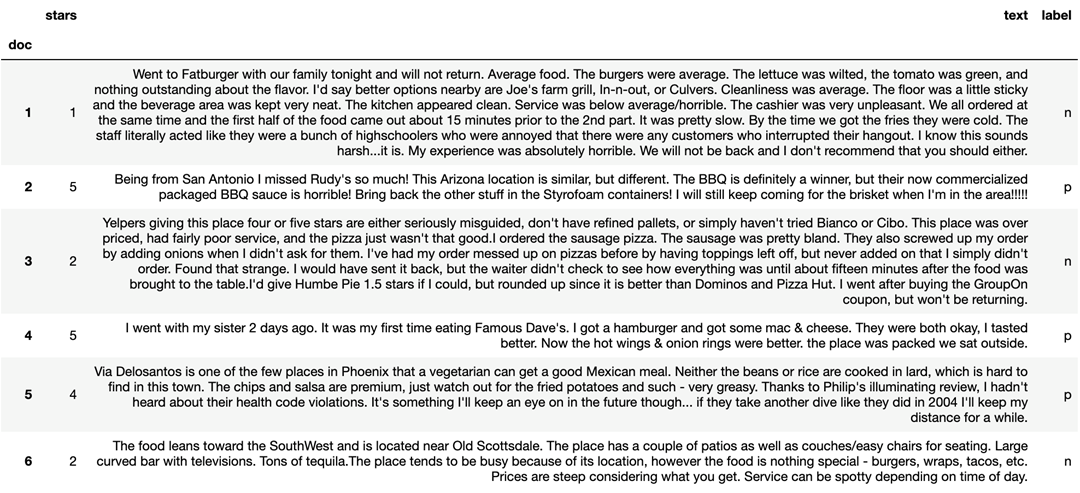
Dataset
The Experiment
The data were used for the Amazon Mechanical Turk (AMT) experiment. The experiment was designed to have five assignments for each of documents, yelp restaurant reviews. In order to get the result in time, a short time period was set up as 2 days. There was no requirement for Turkers to complete the tasks. Five Turkers were expected to be hired for annotating the sentiment of the restaurant reviews. However, in lack of understanding how the AMT workflow works, there were 18 Turkers fulfilled the request. The project was done within four hours. With the price of $0.2 per Human Intelligence Task (HIT) and 30 assignments in total, the total cost is \$7.2 for the entire project.
Analysis and Result
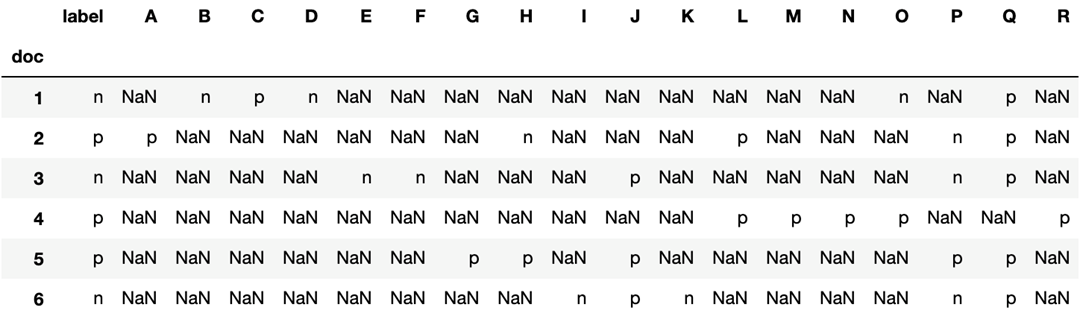
AMT table: Turkers participation and annotation with the ground truth, label
The AMT table above shows the information how the six documents and annotation were distributed into 18 Turkers. It is clear to see that one of the Turkers, annotator Q, has systematic bias, favoring the ‘positive’ label. Another Turker who could be the potential systematic bias is annotator J. That Turker has annotated three ‘positive’ labels when there is only one document actually is ‘positive’. However, the result of the experiment cannot hold the credibility because of lack of evidences. If there are more instances that all six documents were responded by the same Turker, the analysis could be stronger and persuasive.
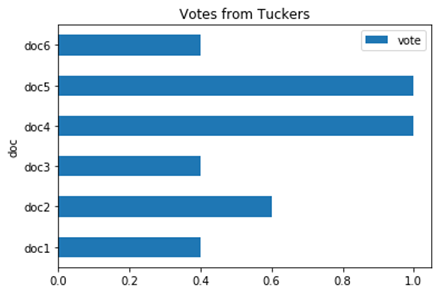
AMT Average vote score
The bar chart above shows the bias between the Annotators and the ground truth. The sentiment labeled from Turkers were calculated for voting. The vote score is the average of the labels score (‘n’:0, ‘p’:1) for each document. If the vote score equal to 1, it means the sentiment label is the same as the ground truth. As the vote score getting lower, it shows that the disagreement between Turkers and the ground truth. By taking closer look at The bar chart, it pointed out that two documents, document 4 and document 5, have the same sentiment. Both documents are positive reviews based on the ground truth. Its review contains positive words or phrase without too much ambiguous sentences or tones, such as ‘Famous’, ‘better’, ‘placed was packed’, ‘premium’, ‘illuminating review’, ‘hadn’t heard code violation’…etc.
The Cohen’s Kappa measure can be used as the tool to compare the degree of agreement on two Annotators or AMT Tukers and ground truth:
|
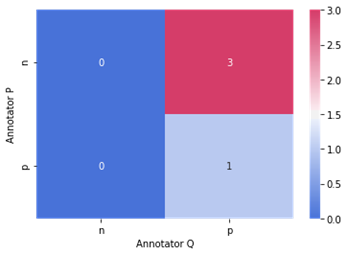
Turker P vs Turker Q |
|
|
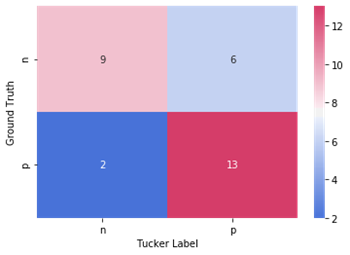
Ground Truth vs AMT Turkers |
|
Since there are two annotators having overlaps on 4 documents, document 2, document 3, document 5 and document 6, the Cohen’s Kappa measure can be used to compare the degree of agreement on two Annotators. The first table above shows the matrix between Annotator P and Annotator Q. The Kappa value was calculated. Both annotators, Annotator P and Annotator Q have poor agreement and the data are not reliable as the ground truth. However, this result cannot represent the conclusion because of the sample size. If there are more labeled data to be compared, the Kappa value could have improvement in this case.
For the degree of agreement between the ground truth and Turkers, a Kappa value was calculated as the second table shown above. The Kappa measurement is 0.467. According to the Interpretation of Cohen’s Kappa table, this value is in ‘moderate agreement’ category. It seems like the annotations from Turkers are not too far from the ground truth but also not too close to the ground truth as well. It may have some reasons. One is that the annotators might be systematic bias, such as annotator Q. The other thing needs to be mentioned is that the samples are not enough for advanced analysis between Turkers. A complete sample, having several Turkers finished all six documents annotation, should be obtained more for identifying the reliability. Based on the result of the experiment, the statement of ‘AMT is a viable approach for obtaining training labels’ cannot not be confirmed in this case. Although the result is not satisfying, it still has the possibility that AMT can be another approach to get the training labels, with restrict requirements on hired workers. By combining the factors, such as cost, time, and resources, into the consideration, using Amazon Mechanical Turk as an alternative to obtain the training data is still a viable approach.
Reference:
Cohen’s kappa, from Wikipedia
Kappa Online Tool
Kappa Value Calculation, from YouTube
Cohen’s Kappa in Excel, from YouTube