

Statistics 101
T-Test
The t-test is any statistical hypothesis test in which the test statistic follows a Student’s t-distribution under the null hypothesis.
A t-test is most commonly applied when the test statistic would follow a normal distribution if the value of a scaling term in the test statistic were known. When the scaling term is unknown and is replaced by an estimate based on the data or it has the small samples ($n < 30$), the test statistics (under certain conditions) follow a Student’s t distribution. The t-test can be used, for example, to determine if the means of two sets of data are significantly different from each other.
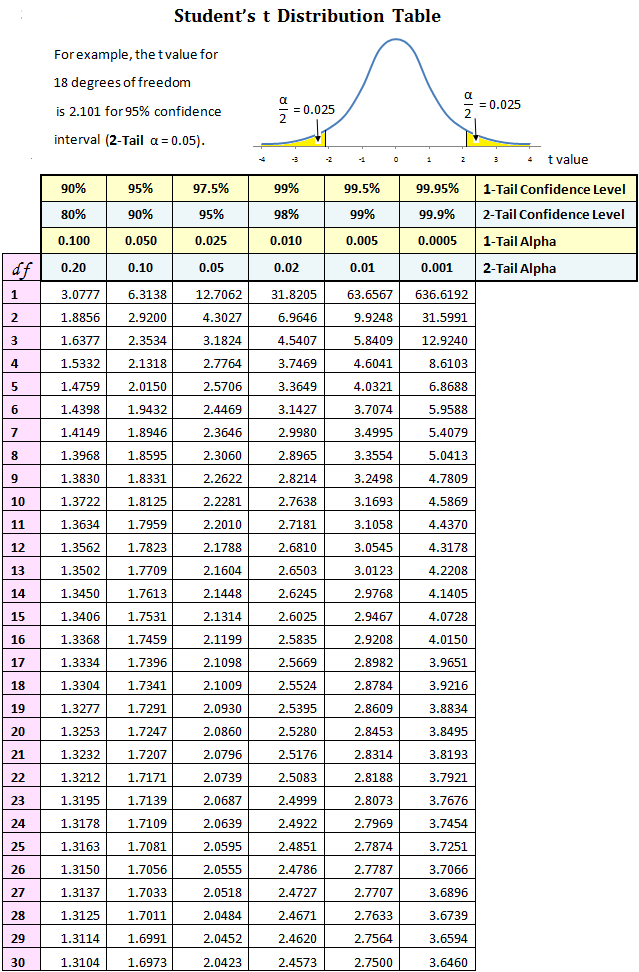
Student t distribution table; Source
The t-test can be categorized into two:
- One-Sample
- Two-Sample
- Paired
- Unpaired
We are going to discuss each of cases in detail.
(1). One-Sample:
The One-Sample Test tests whether the mean of a normally distributed population is different from a specified value.
The workflow of the Test is as below:
Null Hypothesis ($H_0$): states that the population mean is equal to some value ($\mu_0$)
Alternative Hypothesis ($H_a$): states that the mean does not equal/is greater than/is less than $\mu_0$
t-statistic: standardizes the difference between $\bar{x}$ and $\mu_0$
$ t = \frac{\bar{x} - \mu_0}{ \frac{s}{\sqrt{n}} } $
Degree of freedom(df)=n-1
Formula for continuous data
Read the table of t-distribution critical values for the p-value, probability that the sample mean was obtained by chance given $\mu_0$ is the popluation mean, using the calculated t-statistic and degrees of freedom.
- $H_0: \mu \leq \mu_0 \\ H_a: \mu > \mu_0 $
- $\rightarrow\ \\ \text{one-tail test on right-tail; p = area right of t}$
- $H_0: \mu \geq \mu_0 \\ H_a: \mu < \mu_0 $
- $\rightarrow\ \text{one-tail test on left-tail; p = area left of t}$
- $H_0: \mu = \mu_0 \\ H_a: \mu \neq \mu_0 $
- $\rightarrow\ \text{two-tail test; p = 2 * area past t}$
If the p-value is less than the predetermined value for significance, called $\alpha$ and is usually 0.05, reject the null hypothsis and accept the alternative hypothesis.
Example:
You are experiencing hair loss and skin discoloration and think it might be because of selenuim toxicity. You decide to measure the selenium levles in your tap water once a day for one week. Your results are given below. The EPA maximum contaminant level for safe drinking water is 0.05 mg/L. Does the selenium level in your tap water exceed the legal limit (assuming $\alpha = 0.05$)?
| Day | Selenium mg/L |
|---|---|
| 1 | 0.051 |
| 2 | 0.0505 |
| 3 | 0.049 |
| 4 | 0.0516 |
| 5 | 0.052 |
| 6 | 0.0508 |
| 7 | 0.0506 |
Hypothesis:
$H_0: \mu \leq 0.05$
$H_a: \mu > 0.05$
Calculate the mean and standard deviation of the sample:
$\bar{x}=0.0508$
$s^2 = \frac{\Sigma{(x-\bar{x})^2}}{n-1} = \frac{(0.051-0.0508)^2 + (0.0505-0.0508)^2 + etc}{6} = 9.15 \times 10^{-7}$
$s=\sqrt{s^2}=9.56 \times 10^{-4}$
$n=7$
The t-statistics is:
$t = \frac{\bar{x} - \mu_0}{ \frac{s}{\sqrt{n}} } = \frac{0.0508 - 0.05}{ \frac{9.56 \times 10^{-4}}{\sqrt{7}} } = 2.17$
And the degrees of freedom are:
$n-1 = 7-1 = 6$
By looking at the t-distribution table above, 2.17 with 6 degrees of freedom is between $p=0.05$ and $p=0.025$. This means that the p-vale is less than 0.05, so, we can reject $H_0$ and coclude that the selenium level in the tap water exceeds the legal limit.
(2). Two-Sample:
The Two-Sample Test tests whether the means of two population are significantly different from one another. A common application is to test if a new process or treatment is superior to a current process or treatment.
Paired
Each value of one group corresponds directly to a value in the other group. ie: before and after values after drug treatment for each individual patient
Subtract the two values for each individual to get one set of values (the differences) and use $\mu_0=0$ to perform a one-sample t-test.
Unpaired
Assume the two population are independent.
| $H_0: \text{means of the two population are equal}$ | $H_a: \text{means of the two population are unequal or one is greater than the other}$ | Test |
|---|---|---|
| $\mu_1 = \mu_2$ | $\mu_1 \neq \mu_2$ | Two-tail test |
| $\mu_1 \leq \mu_2$ | $\mu_1 > \mu_2$ | One-tail test: right-tail |
| $\mu_1 \geq \mu_2$ | $\mu_1 < \mu_2$ | One-tail test: left-tail |
t-statistic:
$ t = \frac{\bar{x_1}-\bar{x_2}}{\sqrt{\frac{S_1^2}{n_1} + \frac{S_2^2}{n_2} }} $
Degree of freedom(df)= $ (n_1-1) + (n_2-1) = n_1 + n_2 -2$
Formula for continuous data
Read the table of t-distribution critical values for the p-value, probability that the sample mean was obtained by chance given $\mu_0$ is the popluation mean, using the calculated t-statistic and degrees of freedom.
Example:
Consider the lifespan of 18 rats. 12 were fed a restricted calorie diet and lived an average of 700 days (standard deviation = 21 days). The other 6 had unsretricted access to food and lived an average of 668 days (standard deviation = 30 days). Does a restricted calorie diet increase the lifespan of rats (assume $\alpha = 0.05$)?
| Control Group 1 | Treatment Group |
|---|---|
| $n_1=12$ $\bar{x_1}=700$ $s_1=21$ |
$n_2=6$ $\bar{x_2}=668$ $s_2=30$ |
Hypothesis:
$H_0: \mu_1 \leq \mu_2$
$H_a: \mu_1 > \mu_2$
(Because we are only asking if a restricted calorie diet increases lifespan)
The t-statistics is:
$t = \frac{\bar{x_1}-\bar{x_2}}{\sqrt{\frac{S_1^2}{n_1} + \frac{S_2^2}{n_2} }} = \frac{700-668}{\sqrt{\frac{21^2}{12} + \frac{30^2}{6} }} = 2.342$
And the degrees of freedom are:
$(n_1-1) + (n_2-1) = n_1 + n_2 -2 = 12+6-2 = 16$
From the t-distribution table, the p-value (t-statistic = 2.342 with 16 degrees of freedom) falls between 0.01 and 0.02, so, we reject $H_0$. The restricted calorie diet does increase the lifespan of rats.