

Statistics 101
Chi-Square Test
A chi-square test, also written as $X^2$ test, is a statistical hypothesis test that is valid to perform when the test statistic is chi-square distributed under the null hypothesis, specifically Pearson’s chi-square test and variants thereof. Pearson’s chi-square test is used to determine whether there is a statistically significant difference between the expected frequencies and the observed frequencies in one or more categories of a contingency table.
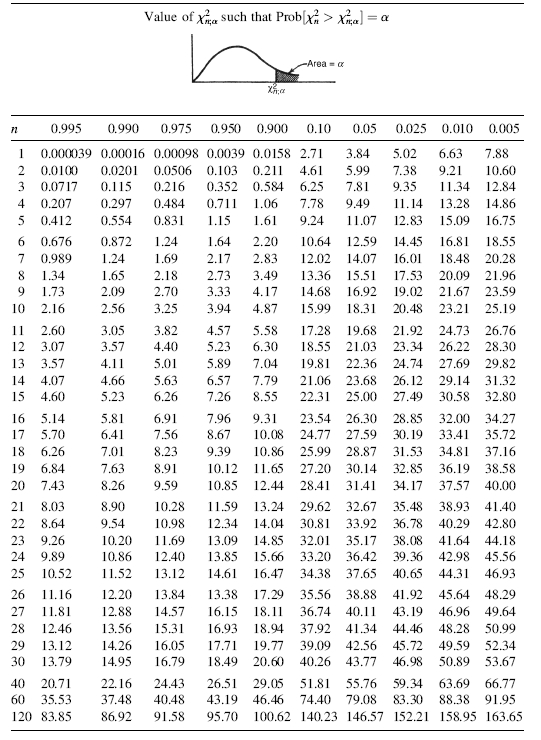
Chi-square table; Source
There are two types of chi-square tests. Both use the chi-square statistic and distribution for different purposes:
We are going to discuss each of cases in detail.
(1). Goodness of Fit Test:
The goodness of fit test is used to test if sample data fits a distribution from a certain population (i.e. a population with a normal distribution or one with a Weibull distribution). In other words, it tells you if your sample data represents the data you would expect to find in the actual population.
- $H_0: \text{The observed pattern fits the given distribution}$
- $H_a: \text{The observed pattern does not fit the given distribution}$
- The chi-square statistic:
- $X^2 = \Sigma{\frac{(O-E)^2}{E}}$
- Where $O$ is the observed value and $E$ is the expected value
- Formula for categorical discrete data
- $\text{Degree of freedom = number of categories in the distribution -1}$
Get the p-value from the Chi-square table using the calculated $X^2$ and df values:
- If the p-value is less than $\alpha$, $p < \alpha$, the observed data does not fit the expected distribution
- If the p-value is greater than $\alpha$, $p > \alpha$, the data likely fits the expected distribution
Example 1:
You breed Puffskeins and would like to determine the pattern of inheritance for coat color and purring ability. Puffskeins come in either pink or purple and can either purr or hiss. You breed a puredbred, pink purring male with a purebred, purple hissing female. All individuals of the $F_1$ generation are pink and purring. The $F_2$ offspring are shown below. Do the alleles for coat color and purring ability assort independently (assume $\alpha = 0.05$)?
| Pink and Purring | Pink and Hissing | Purple and Purring | Purple and Hissing |
|---|---|---|---|
| 143 | 60 | 55 | 18 |
Hypothesis:
Independent assortment means the distribution of $F_1$ generation has a phenotypic ratio of 9:3:3:1 (hypothetically).
$H_0: \text{The observed distribution of $F_2$ offspring fits the distribution of $F_1$ generation}$
$H_a: \text{The observed distribution of $F_2$ offspring does not fit the distribution of $F_1$ generation}$
Calculate the expected values:
| Pink and Purring | Pink and Hissing | Purple and Purring | Purple and Hissing |
|---|---|---|---|
| 155.25 | 51.75 | 51.75 | 17.25 |
The chi-square statistic:
$ X^2 = \Sigma{\frac{(O-E)^2}{E}}=\frac{(143-155.25)^2}{155.25} + \frac{(55-51.75)^2}{51.75} + \frac{(55-51.75)^2}{51.75} + \frac{(18-17.25)^2}{17.25} \approx 2.519 $
The degrees of freedom:
$df=4-1=3$
From the Chi-square table, the p-value is greater than 0.1 ($\alpha = 0.05$). So, we we fail to reject $H_0$. The observed distribution of $F_2$ offspring fits the distribution of $F_1$ generation.The alleles for coat color and purring ability do assort independently in Puffskeins.
Example 2:
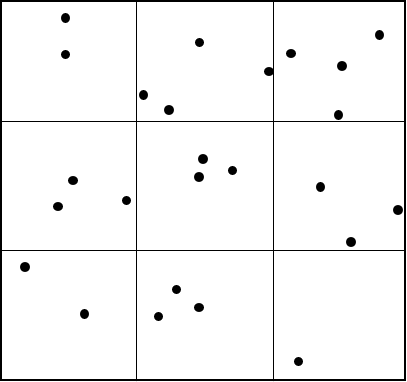
You are studying the pattern of dispersion of king penguins and the diagram below represents an area you sampled. Each dot is a penguin. Do the penguins display a uniform distribution (assume $\alpha=0.05$)
Hypothesis:
$H_0: \text{There is a uniform distribution of penguins}$
$H_a: \text{There is not a uniform distribution of penguins}$
There are a total of 25 penguins. So, if there is a uniform distribution, there should be 2.778 penguins per square.
There actual observed values are 2, 4, 4, 3, 3, 3, 2, 3, 1, so the $X^2$ statistic is:
$ X^2 = \Sigma{\frac{(O-E)^2}{E}}= \frac{(2-2.778)^2}{2.778} + \frac{(4-2.778)^2}{2.778} + \frac{(4-2.778)^2}{2.778} + \frac{(3-2.778)^2}{2.778} + \frac{(3-2.7787)^2}{2.778} + \frac{(3-2.778)^2}{2.778} + \frac{(2-2.778)^2}{2.778} + \frac{(3-2.778)^2}{2.778} + \frac{(1-2.778)^2}{2.778} \approx 2.72 $
The degrees of freedom:
$df=9-1=8$
From the Chi-square table, the p-value is greater than 0.95 ($\alpha = 0.05$). So, we fail to reject $H_0$. The penguins do display a uniform distribution.
(2). Independence Test:
A chi-square test for independence compares two variables in a contingency table to see if they are related (independence). In a more general sense, it tests to see whether distributions of categorical variables differ from each another.
- A very small chi square test statistic means that your observed data fits your expected data extremely well.
- In other words, there is a relationship.
- A very large chi square test statistic means that the data does not fit very well.
- In other words, there is not a relationship.
Workflow:
- $H_0: \text{The two variables are independent (not related)}$
- $H_a: \text{The two variables are not independent (related)}$
- It does not make any assumptions about an expected distribution
- The observe values, $\#_1, \#_2, \#_3, \#_4$, are usually presented as a table. Each row is a category of variable 1 and each column is a category of variable 2
- The proportion of category x of variable 1 is the number of individuals in category x divided by the total number of individuals, $\frac{\#_1 + \#_3}{\#_1 + \#_2 + \#_3 + \#_4}$.
- Assuming independence, the expected number of individuals that fall within category a of variable 2 is the proportion of category x multiplied by the number of individuals in category a, $(\frac{\#_1 + \#_3}{\#_1 + \#_2 + \#_3 + \#_4})(\#_1 + \#_2)$.
- The expected value is:
$E = \frac{(\#_1 + \#_3)(\#_2 + \#_4)}{\#_1 + \#_2 + \#_3 + \#_4} = \frac{(\text{row total})(\text{column total})}{\text{grand total}}$
- The chi-square statistic:
- $X^2 = \Sigma{\frac{(O-E)^2}{E}}$
- Where $O$ is the observed value and $E$ is the expected value
- Formula for categorical discrete data
- Degree of freedom:
- $\text{df = (r-1)(c-1)}$
- Where $r$ is the number of rows and $c$ is the number of columns
- Read the p-value from $X^2$ table.

Example:
Given the data below, is there a relationship between fitness level and smoking habits (assume $\alpha = 0.05$)?

Hypothesis:
$H_0: \text{Fitness level and smoking habits are independent (not related)}$
$H_a: \text{Fitness level and smoking habits are not independent (related)}$
Use the expected value formula, $\frac{(\text{row total})(\text{column total})}{\text{grand total}}$, to get the expected counts:

The chi-square statistic:
$$ X^2 = \Sigma{\frac{(O-E)^2}{E}} = \frac{(113-123.75)^2}{123.75} + \frac{(113-124)^2}{124} + \frac{(110-124.26)^2}{124.26} + etc... = 91.73 $$
And the degrees of freedom are:
$df = (r-1)(c-1) = (4-1)(4-1) = 9$
From the Chi-square table, the p-value is less than 0.005 ($\alpha = 0.05$). So, we reject $H_0$ and conclude that there is a relationship between fitness level and smoking habits.