
Covariance vs Correlation Coefficient
Before starting to talk about the covariance and correlation coefficient, the types of relationships, positive relationship and negative relationship, must be mentioned in the beginning.
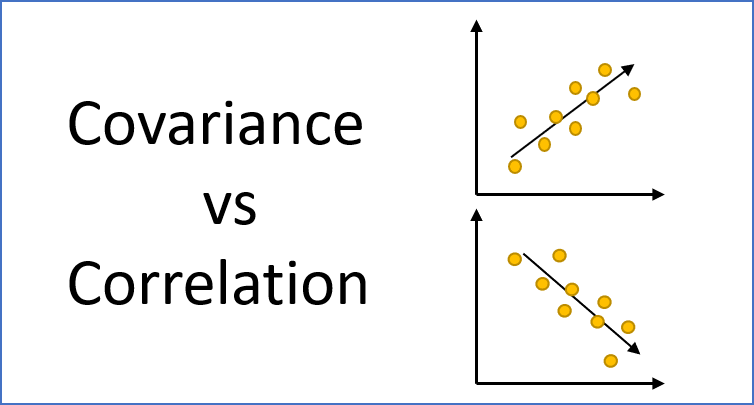
Types of Relationships
Positive Relationship:
In a positive relationship, high values on one variable are associated with high values on the other and low values on one are associated with low values on the other. For instance, according to the data, we can deduce that there is a positive relationship between the salary expectation variable and years in school variable. The longer the of the years staying in school leads the higher salary expectation.

Negative Relationship:
On the other hand a negative relationship implies that high values on one variable are associated with low values on the other. By using the salary expectation example, the scatter plot shown below indicates that there is a negative relationship between two variables. The longer you stay in the school, the less salary you expect to have.

Covariance
Covariance is a statistical tool that is used to determine the relationship between the movement of two variables. It is usually denoted as $cov(x,y)$. Here, we use $S_{xy}$ in the following.
The value of the covariance is not standardized. It has no boundaries, ranging from negative infinity to positive infinity. Thus, the value for a perfect linear relationship depends on the data. Because the data are not standardized, it is difficult to determine the strength of the relationship (positive/negative) between two variables.
- The formula for Covariance:
- $ S_{xy} = \frac{\Sigma{ (x_i - \bar{x})(y_i - \bar{y}) }}{n-1} $
- $\text{where $\bar{x}$ and $\bar{y}$ are the mean of the x and y variables; $n$ is the total number of paired observations for variable x and variable y}$
Correlation Coefficient
Correlation is a statistical technique that can show whether and how strongly pairs of variables are related. It is usually denoted as $cor(x,y)$. Here, we use $r_{xy}$ in the following.
Correlation coefficients are standardized. Its values are ranging from 1 to negative 1. Thus, a perfect linear relationship results in a coefficient of 1. The correlation measures both the strength and direction of the linear relationship between two variables.
- The formula for Correlation Coefficient:
- $ r_{xy} = \frac{ S_{xy} }{ S_x S_y } $
- $\text{where $S_x$ and $S_y$ are the standard deviation of the x and y variables; $S_{xy}$ is the covariance of the x and y variables}$
Example:
An institution wants to find out the relationship between temperature and ice cream sales. The data are collected as shown below:
| Temperature | Ice cream sales |
|---|---|
| 66 | 8 |
| 72 | 11 |
| 77 | 15 |
| 84 | 20 |
| 83 | 21 |
| 71 | 11 |
| 65 | 8 |
| 70 | 10 |
The mean and standard deviation of temperature and ice cream sales:
| Temperature | Ice cream sales | |
|---|---|---|
| Mean: | 73.5 | 13 |
| Standard Deviation: | 7.19 | 5.13 |
Covariance calculation table:
| Temperature | Ice cream sales | Ice cream sales |
|---|---|---|
| -7.5 | -5 | 37.5 |
| -1.5 | -2 | 3 |
| 3.5 | 2 | 7 |
| 10.5 | 7 | 73.5 |
| 9.5 | 8 | 76 |
| -2.5 | -2 | 5 |
| -8.5 | -5 | 42.5 |
| -3.5 | -3 | 10.5 |
| Sub total: | 255 |
- Number of paired observation (n) = 8
- Covariance:
$ cov(x,y) = S_{xy} = \frac{\Sigma{ (x_i - \bar{x})(y_i - \bar{y}) }}{n-1} = \frac{255}{7} \approx 36.43 $
There is a positive relationship between temperature and ice cream sales. But, we do not know how strong the relationship is.
- Correlation Coefficient:
$ cor(x,y) = r_{xy} = \frac{ S_{xy} }{ S_x S_y } = \frac{ 36.43 }{ (7.19)(5.13) } \approx 0.99 $
The correlation coefficient is close to 1, indicating that there is a strong positive relationship between temperature and ice cream sales.
Reference:
Covariance and Correlation Coefficient Video
Covariance and correlation